Showing posts with label kendo diagram. Show all posts

Sunday, March 21, 2021

Kendo Diagram Center Connection Example

This article is an example of the Kendo Diagram Component. The framework used is the Kendo UI for jQuery. In this example, we are tasked to make the connections hit the center of the shape instead of the edges. This example builds upon Kendo Diagram Connection Example.

Here is our solution. You can edit the code below using any text editor but I prefer Visual Studio Code. Make sure you are connected to the Internet because the code pulls the Kendo library from the Telerik CDN. Take note that this is just a demonstration code and you'll need to purchase a license if you are going to
use Kendo UI for jQuery for more than just evaluation purposes.

The notable changes are:

The toConnector and fromConnector in the connectionsDataSource. This tells the component which connector to hit.
The addition of the center connector.
On the change event, we make sure the connections are set to the background and the shapes are set to the foreground.
On the dataBound event, we set the shapes to the foreground.


Open the HTML file in a browser and you should see an output similar to the one shown below.

Kendo Diagram Center Connection Example


There you have it. A quick and simple example of how to use the Kendo Diagram with center connection.

Saturday, March 13, 2021

Kendo Diagram Connection Example

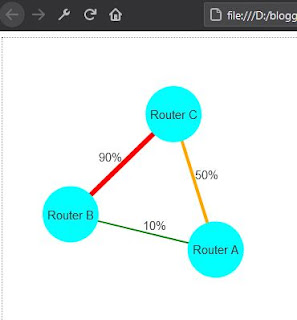
This article is an example of the Kendo Diagram Component. The framework used is the Kendo UI for jQuery. In this example, we are tasked to show the level of traffic between routers.
Here are the requirements:

  1. If the traffic high, above 80%, show a red thick connection between routers.
  2. If the traffic is medium, above 40%, show an orange medium thickness connection.
  3. If traffic is low, show a green thin connection.

Here is our solution. You can edit the code below using any text editor but I prefer Visual Studio Code. Make sure you are connected to the Internet because the code pulls the Kendo library from the Telerik CDN. Take note that this is just a demonstration code and you'll need to purchase a license if you are going to use Kendo UI for jQuery for more than just evaluation purposes.

On the change event, we capture the connections and redraw it accordingly.

<!DOCTYPE html>
<html>
<head>
    <meta charset="UTF-8">
    <title>Kendo Diagram Connection Example</title>
    <link rel="stylesheet" href="https://kendo.cdn.telerik.com/2021.1.119/styles/kendo.default-v2.min.css"/>
    
    <script src="http://code.jquery.com/jquery-3.5.1.min.js"></script>
    <script src="https://kendo.cdn.telerik.com/2021.1.119/js/kendo.all.min.js"></script>
</head>

<body>
    <div id="diagram"></div>
<script>
$("#diagram").kendoDiagram({
    editable: {
        remove: false,
        resize: false,
        tools: false,
    },
    zoomRate: 0.5,
    zoomMax: 1.5,
    zoomMin: 0.6,
    dataSource: [
        {id:'a', name:'Router A'},
        {id:'b', name:'Router B'},
        {id:'c', name:'Router C'},
    ],
    connectionsDataSource:[
        {from:'a', to:'b', traffic: 10},
        {from:'a', to:'c', traffic: 50},
        {from:'b', to:'c', traffic: 90},
    ],
    layout: {
        type: 'force',
        nodeDistance: 200,
    },
    shapeDefaults: {
        type: 'circle',
        fill: '#00ffff',
        content: {
            template: '#= name #'
        },
        width: 70,
        height: 70,
        hover: {
            fill: '#6495ed'
        },
        editable: {
            connect: false,
            tools: false,
        },
    },
    connectionDefaults: {
        type: 'polyline',
        editable: false,
        content:{
            template: '#= traffic#%',
        }
    },
    change: function(e) {
        for (let i = 0; i < e.added.length; i++) {
            if (e.added[i] instanceof 
                kendo.dataviz.diagram.Connection) {
                var traffic = e.added[i].dataItem.traffic;
                var color = 'green';
                var thickness = 2;
                if (traffic > 80) {
                    color = 'red';
                    thickness = 6;
                } else if (traffic > 40) {
                    color = 'orange';
                    thickness = 4
                }

                e.added[i].redraw({
                    stroke: {
                        color: color,
                        width: thickness,
                    }
                });
            }
        }
    },
});
</script>
</body>
</html>

Open the HTML file in a browser and you should see an output similar to the one shown below.
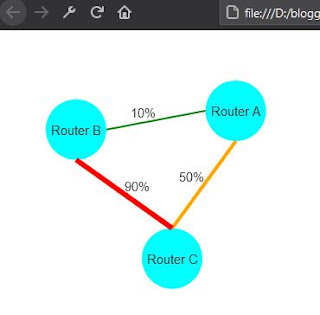
Kendo Diagram Connection Example
Kendo Diagram Connection

There you have it. A quick and simple example of how to use the Kendo Diagram with custom connections.
Sunday, January 17, 2021

Kendo Diagram Double Click Example

This article is an example of the Kendo Diagram Component with a double click event handler. The framework used is the Kendo UI for jQuery. This example builds upon the Kendo Diagram Example. After we were tasked to create a link graph, we must now handle a double click event on a shape. Here are the requirements:

  1. Show the shape ID and Name when a shape is double clicked.
  2. Zoom level must not change on double click.

Here is our solution. You can edit the code below using any text editor but I prefer Visual Studio Code. Make sure you are connected to the Internet because the code pulls the Kendo library from the Telerik CDN. Take note that this is just a demonstration code and you'll need to purchase a license if you are going to use Kendo UI for jQuery for more than just evaluation purposes.

The two main points here are:

  1. By default, Kendo Diagram zooms in when we double click. So we capture the event in zoomStart and prevent it from propagating.
  2. Kendo Diagram does not provide a double click event API. So we had to bind it manually using jQuery and find the shape based on its position.
<!DOCTYPE html>
<html>
<head>
    <meta charset="utf-8"/>
    <title>Kendo UI Diagram Example</title>

    <link rel="stylesheet" href="https://kendo.cdn.telerik.com/2020.3.1118/styles/kendo.default-v2.min.css"/>

    <script src="https://code.jquery.com/jquery-1.12.4.min.js"></script>
    <script src="https://kendo.cdn.telerik.com/2020.3.1118/js/kendo.all.min.js"></script>
</head>
<body>
  
<div id="diagram"></div>
<script>
var $diagram = $('#diagram');
var diagram = $diagram.kendoDiagram({
    editable: {
        remove: false,
        resize: false,
        tools: false,
    },
    zoomRate: 0.5,
    zoomMax: 1.5,
    zoomMin: 0.6,
    dataSource: [
        {id:'king', name:'King'},
        {id:'queen', name:'Queen'},
        {id:'bishop', name:'Bishop'},
    ],
    connectionsDataSource:[
        {from:'king', to:'queen', label: '10%'},
        {from:'king', to:'bishop', label: '40%'},
        {from:'queen', to:'bishop', label: '55%'},
    ],
    layout: {
        type: 'force',
        nodeDistance: 200,
    },
    shapeDefaults: {
        type: 'circle',
        content: {
            template: '#= name #'
        },
        width: 70,
        height: 70,
        hover: {
            fill: 'Orange'
        },
        editable: {
            connect: false,
            tools: false,
        },
    },
    connectionDefaults: {
        type: 'polyline',
        editable: false,
        content:{
            template: '#= label#'
        }
    },
    zoomStart: function(e) {
        if (e.meta.type === 'doubleTap') {
            e.preventDefault();
        }
    }
}).data('kendoDiagram');

$diagram.unbind('dblclick');
$diagram.bind('dblclick', function(e) {
    var position = diagram.documentToModel({
        x: e.pageX,
        y: e.pageY,
    });
    var targetShape = shapeByPosition(position);
    if (targetShape) {
        alert(targetShape.dataItem.id + ': ' +
            targetShape.dataItem.name);
    }
});

function shapeByPosition(position) {
    var shapes = diagram.shapes;
    for (let i = 0; i < shapes.length; i++) {
        var shape = shapes[i];
        if (shape.bounds().contains(position)) {
            return shape;
        }
    }
}
</script>
</body>
</html>


Open the HTML file in a browser and you should see an output similar to the one shown below.

Kendo Diagram Double Click
Kendo Diagram Double Click Example


There you have it. A quick and simple example of how to use the Kendo Diagram component with a double click event handler.

Saturday, January 2, 2021

Kendo Diagram Example

This article is an example of the Kendo Diagram Component. The framework used is the Kendo UI for jQuery. In this example, we are tasked to create a link graph.

Here are the requirements:

  1. Zoomable
  2. Not editable
  3. Nodes must be movable
  4. Connections between nodes have labels

Here is our solution. You can edit the code below using any text editor but I prefer Visual Studio Code. Make sure you are connected to the Internet because the code pulls the Kendo library from the Telerik CDN. Take note that this is just a demonstration code and you'll need to purchase a license if you are going to use Kendo UI for jQuery for more than just evaluation purposes.


<!DOCTYPE html>
<html>
<head>
    <meta charset="utf-8"/>
    <title>Kendo UI Diagram Example</title>

    <link rel="stylesheet" href="https://kendo.cdn.telerik.com/2020.3.1118/styles/kendo.default-v2.min.css"/>

    <script src="https://code.jquery.com/jquery-1.12.4.min.js"></script>
    <script src="https://kendo.cdn.telerik.com/2020.3.1118/js/kendo.all.min.js"></script>
</head>
<body>
  
<div id="diagram"></div>
<script>
 $("#diagram").kendoDiagram({
    editable: {
        remove: false,
        resize: false,
        tools: false,
    },
    zoomRate: 0.5,
    zoomMax: 1.5,
    zoomMin: 0.6,
    dataSource: [
        {id:'king', name:'King'},
        {id:'queen', name:'Queen'},
        {id:'bishop', name:'Bishop'},
    ],
    connectionsDataSource:[
        {from:'king', to:'queen', label: "10%"},
        {from:'king', to:'bishop', label: "40%"},
        {from:'queen', to:'bishop', label: "55%"},
    ],
    layout: {
        type: 'force',
        nodeDistance: 200,
    },
    shapeDefaults: {
        type: 'circle',
        content: {
            template: '#= name #'
        },
        width: 70,
        height: 70,
        hover: {
            fill: 'Orange'
        },
        editable: {
            connect: false,
            tools: false,
        },
    },
    connectionDefaults: {
        type: 'polyline',
        editable: false,
        content:{
            template: '#= label#'
        }
    }
});
</script>
</body>
</html>

Open the HTML file in a browser and you should see an output similar to the one shown below.

Kendo Diagram Example
 

There you have it. A quick and simple example of how to use the Kendo Diagram component.